



On October 2, 2026, Cloudflare announced longer analytics history, including Free and Pro plans. This helps when you notice a traffic drop late and need to investigate an earlier period. However, more history does not turn HTTP requests into people or establish that Cloudflare caused a decline in Google traffic.
What changes and which limits remain
The announcement describes at least 30 days of analytics on every plan. Adaptive HTTP, security and DNS datasets retain at least 31 days on Free and Pro, with query windows of up to 30 days. Previously, history ranged from 24 hours to 8 days depending on the dataset. This does not unlock every field or remove the separate limits of aggregated datasets. Cloudflare announcement.
Retention and query window are different: one is how long information is kept; the other is how much time one query can cover. Before automating exports, check your zone and dataset boundaries through settings. Do not read the announcement as a promise to recover older data that has already been deleted. API limits.
Cloudflare, Analytics and Search Console answer different questions
| Tool | Useful question | Conclusion to avoid |
|---|---|---|
| Cloudflare HTTP Analytics | Which requests arrive, what responses do they receive, and which security actions apply? | “100,000 requests mean 100,000 visitors.” |
| Google Analytics 4 | Which sessions and actions does the website measurement record? | “No recorded session means nobody accessed the site.” |
| Google Search Console | How are Google clicks, impressions and positions changing? | “Fewer clicks mean the server was down.” |
A page loads multiple resources. Bots and API calls also create requests without representing readers. Browser measurement can be limited by consent, blockers or configuration. Compare compatible trends rather than expecting identical totals. Cloudflare documents these differences between measurement systems.
For metric definitions, see GA4 sessions and the Search Console performance report.
A real check and what it actually establishes
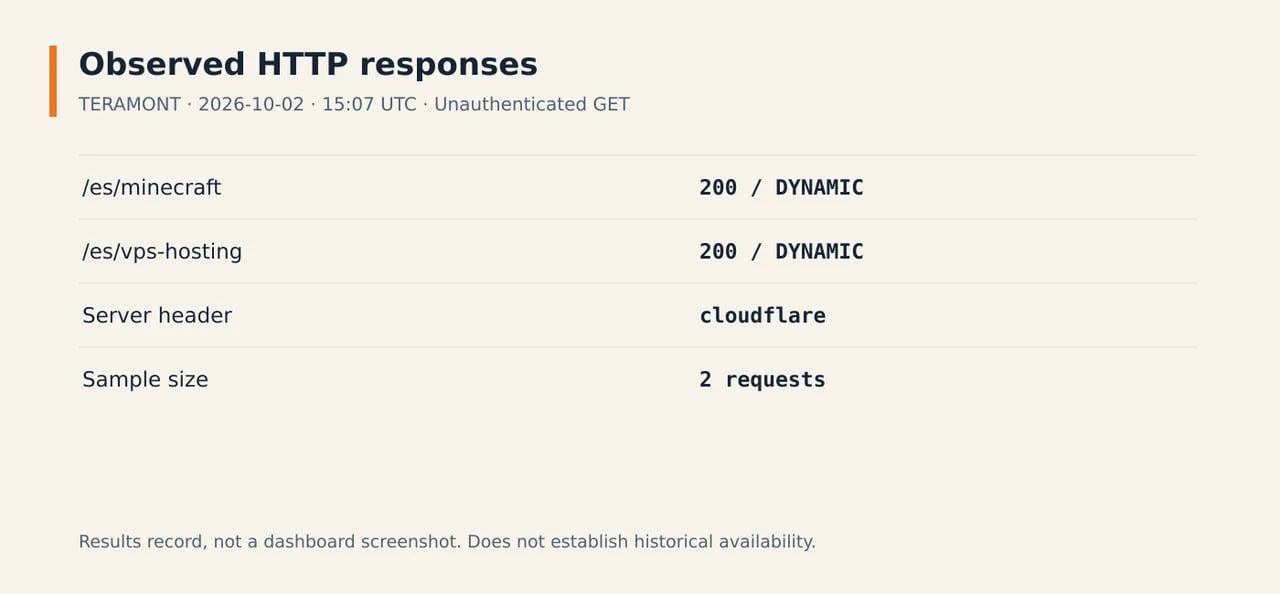
On October 2 at 15:07 UTC, we sent one unauthenticated GET request to each of two public TERAMONT pages from a single environment. We read the response bodies and headers without impersonating Googlebot or changing rules. These were the results:
| Requested path | HTTP | Server | CF-Cache-Status |
|---|---|---|---|
| /es/minecraft | 200 | cloudflare | DYNAMIC |
| /es/vps-hosting | 200 | cloudflare | DYNAMIC |
Investigate what happens on your server too
Explore TERAMONT VPS Hosting if you need to manage your application environment. Plan resources and maintenance around your project.

Interpretation: both requests returned the document at that moment. DYNAMIC is not an error: Cloudflare considered the resource ineligible for caching for that request. It does not mean the entire website has no caching. Official cache status definitions.
Test limitations: these are two observations, not a load test, a 30-day audit or a check of the new history inside a Free account. They do not rule out intermittent failures, blocks affecting other users or problems in another country.
To inspect the headers of an equivalent GET request, replace the domain with your own. This downloads the response without saving its body and does not change your website:
curl --max-time 30 -sS -D - -o /dev/null https://teramont.net/es/minecraftHow to investigate a drop without guessing the cause
- Define the problem. Record when it started, which page is affected, and whether you mean fewer clicks, fewer sessions or loading errors. An SEO decline and a server outage are different problems.
- Use comparable periods. Compare seven complete days with the previous seven, accounting for time zones and filters. Then widen the view to establish whether the change began earlier.
- Inspect the same path in Cloudflare. Select the domain and open Analytics. Review traffic, security and origin information for the same interval. Available filters depend on the plan; distinguish the visitor-facing response status from the origin status.
- Look for verifiable coincidences. If server errors rise, compare their timestamps with application logs and deployments. If blocks appear, check the path, action and matching rule before changing protection.
- Verify after making a change. Preserve the previous configuration, make a narrowly scoped adjustment if warranted, and repeat the observation. Do not disable the entire firewall to test a suspicion.
The Zone Analytics documentation explains the views. Check whether charts use sampling: an aggregate estimate does not replace a record of an individual event.
What we would check in three common situations
| Observation | Next check |
|---|---|
| Google clicks fall without relevant errors appearing | Break down pages and queries in Search Console. The server is not definitively ruled out, but there is no basis yet to blame the firewall. |
| 5xx errors increase immediately after a deployment | Inspect application logs, dependencies and resource usage at that time before upgrading the VPS. |
| Requests rise but sessions do not | Separate assets, bots and API traffic from HTML pages; also verify that browser measurement still works. |
These are investigation paths, not established causes. For more context on automated requests, see our guide to bot traffic and hosting.
Our recommendation
Use the longer history to preserve context and test hypotheses. Do not change plans or servers merely because one chart shows fewer visits. If you need control over the origin, its logs and deployments, consider TERAMONT VPS Hosting; Cloudflare and the server serve different purposes and can work together.
Documentation review and HTTP check: October 2, 2026. The cover and Monty are AI-generated illustrations; the inline record reproduces the two request results, not a screenshot of the Cloudflare dashboard.